Description
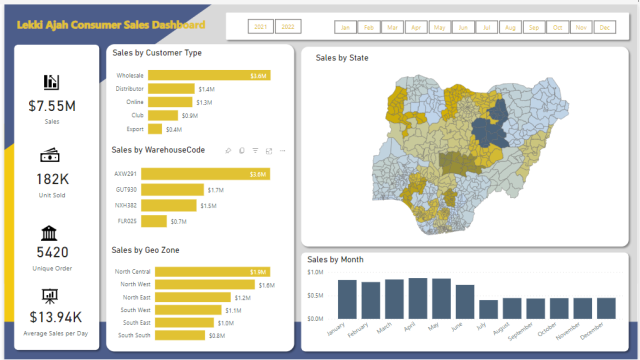
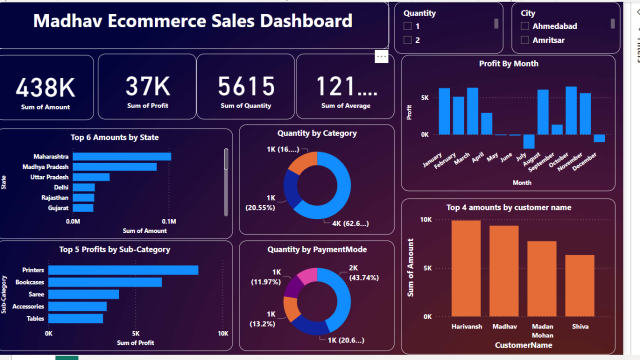
The Consumer Sales Goods Dashboard provides a comprehensive overview of sales performance and key metrics for a company’s consumer products. With a focus on analyzing sales data from various dimensions, this dashboard offers valuable insights into customer behavior, geographic trends, and overall sales performance. The dashboard’s key features include sales analysis by customer type, state, geographical location, warehouse, and date.
Sales by Customer Type: This section of the dashboard displays a visual representation of sales categorized by different customer types. It enables the identification of trends and patterns in consumer purchasing behavior, such as sales volume and revenue generated by different customer segments. By understanding the distribution of sales across customer types, businesses can tailor their marketing and sales strategies accordingly.
Sales by State: The Sales by State section provides a geographical breakdown of sales performance across different states. It allows businesses to identify regions where their products are most popular or areas that require additional attention. By analyzing sales by state, companies can optimize their distribution network, target specific regions for promotional activities, and make informed decisions to maximize revenue.
Sales by Geographical Location: This feature of the dashboard provides an interactive map visualization, showing sales data based on geographical locations. It offers a visual representation of sales trends across different areas, enabling businesses to identify high-performing regions and potential growth opportunities. By drilling down into specific locations, companies can understand consumer preferences and adapt their sales strategies accordingly.
Sales by Warehouse: The Sales by Warehouse section presents an analysis of sales performance across different warehouses or distribution centers. It helps businesses monitor the efficiency and effectiveness of each warehouse in terms of sales generated. This information can assist in optimizing inventory management, identifying underperforming locations, and improving overall supply chain operations.
Sales by Date: This section of the dashboard showcases sales trends over time, allowing businesses to track their performance and identify seasonal patterns or fluctuations in demand. By visualizing sales data by date, companies can make informed decisions regarding inventory planning, sales forecasting, and resource allocation.
Key Performance Indicators (KPIs): The dashboard prominently displays essential KPIs, including total sales, total units sold, total unique orders, and average sales per day. These metrics provide a snapshot of overall sales performance and enable businesses to monitor their progress towards set goals. By tracking these KPIs, companies can identify areas of improvement, evaluate the success of marketing campaigns, and benchmark their performance against previous periods.
Filtering Options: The dashboard offers filtering options to focus on specific timeframes. Users can filter the data by year and month, allowing for a detailed analysis of sales performance within specific periods. This feature enables users to drill down into specific timeframes and compare sales across different periods, identify trends, and make data-driven decisions based on historical sales data.
