Power BI Solutions
-
$9.99
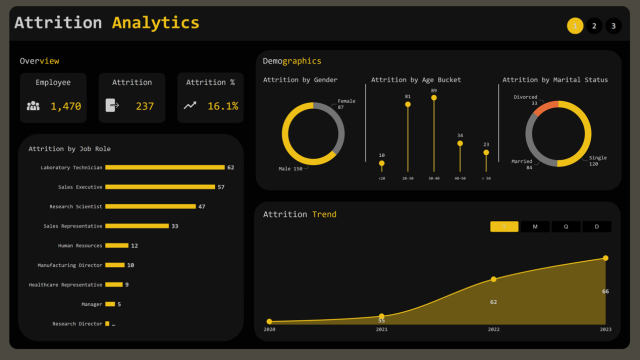
Attrition Analysis dashboard is a powerful tool used by Human Resources departments to visually track, analyze, and display key performance indicators (KPIs), HR metrics, and key data points related to attrition.
Files included:
- Dashboard
- Dataset
-
$59.00
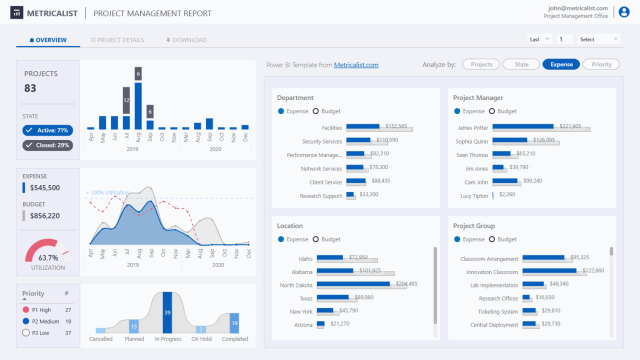
Our latest Project Management Report Template was designed to provide comprehensive insights into your project’s performance, progress and budget allocation. This template is perfect for project managers looking to optimize their project tracking and reporting with Power BI.
-
$49.00
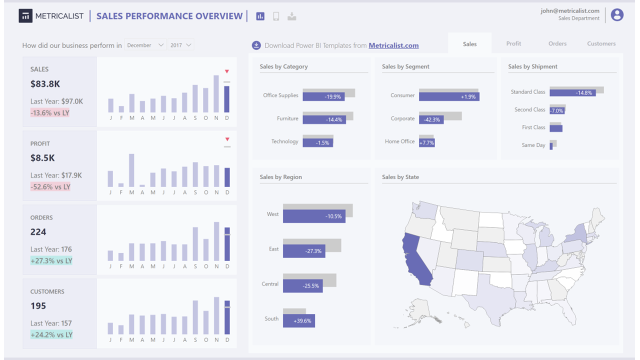
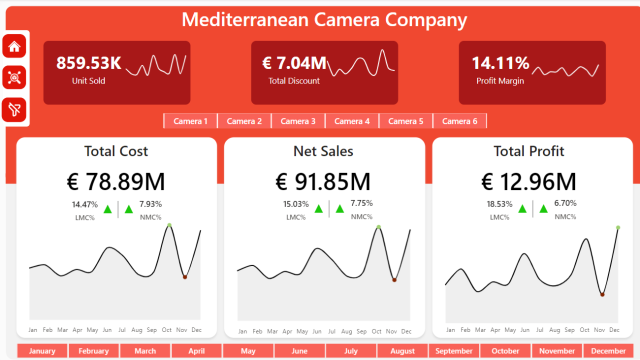
Our Sales Performance Report template provides an in-depth analysis of sales data, helping you identify trends, monitor performance, and make data-driven decisions. This report is designed to be both comprehensive and user-friendly, ensuring that you can get the insights you need with ease.
-
$59.00
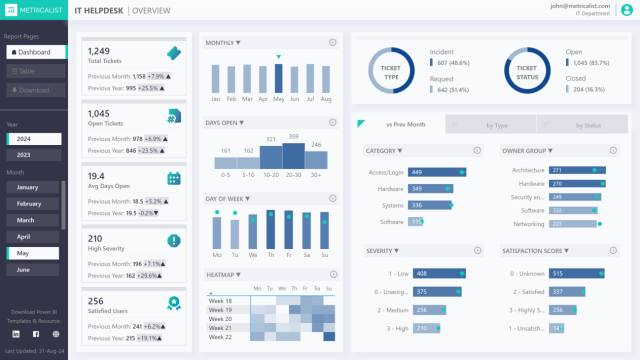
Our IT Help Desk Report provides comprehensive insights into your help desk operations, allowing you to monitor performance and identify areas for improvement. The modern and clean layout is both easy on the eyes and easy to revise and maintain; no unnecessary visual elements and complex design/bookmarks that add additional overhead when loading the report.
-
$19.99
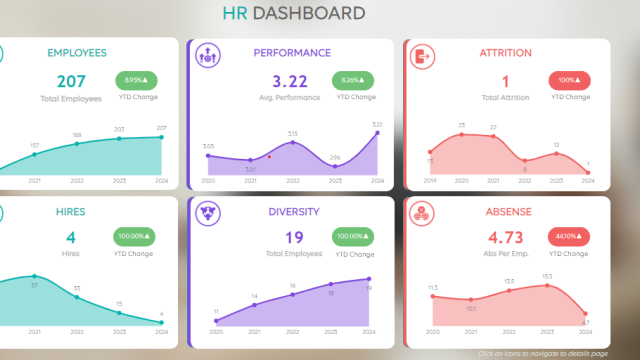
HR dashboard is a powerful tool used by Human Resources departments to visually track, analyze, and display key performance indicators (KPIs), HR metrics, and key data points related to employee performance, recruitment, retention, and overall workplace management.
It is divided into mainly 6 sections: Employees Hires Diversity Performance Absence Attrition -
$16.00
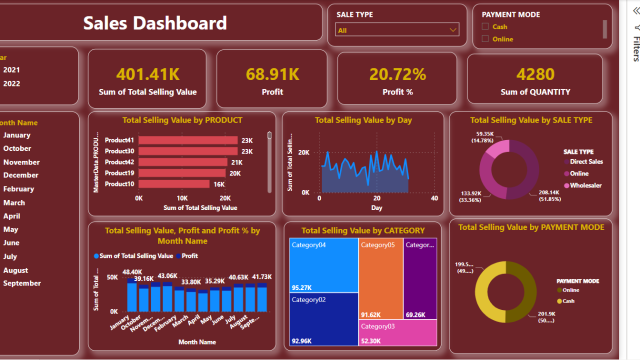
I am excited to share sales dashboard with the help of power bi desktop.
The whole process involved the following
1.Fetch the data
2.Cleaning the data
3.Use functions
4.Use KPIs ,Donut chart ,Bar chart ,Slicers
Feedbacks and suggestions are welcomed.
-
$25.00
You can use this template to analyze any kind of sales data.
-
$25.00
Anyone can use this template to show the product wise analysis based on infographics of products.
-
$20.00
End-to-end steps are covered with all best practices. The report is created to use some advanced Map along with Bookmark, Page navigation, etc
-
$100.00
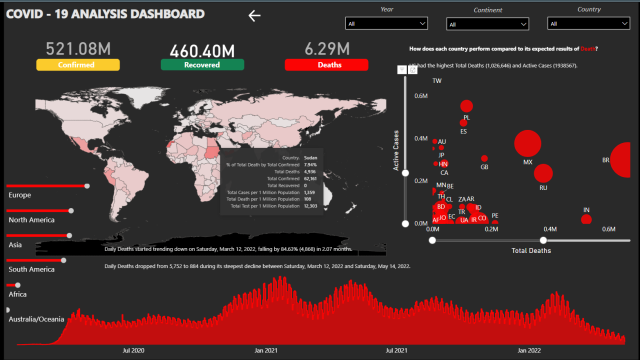
The COVID-19 Analysis Dashboard provides a comprehensive overview of the global COVID-19 situation. Through detailed analysis of confirmed, recovered, and death cases, users can track the spread and impact of the virus across continents and countries. The filtering options for year, continent, and country allow for a more targeted analysis, providing valuable insights for policymakers, researchers, and the general public to understand and respond to the ongoing pandemic.
