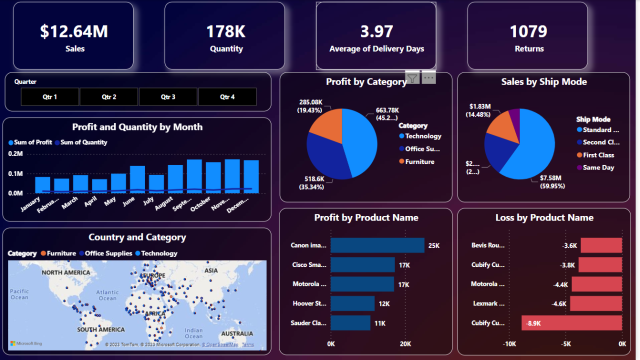
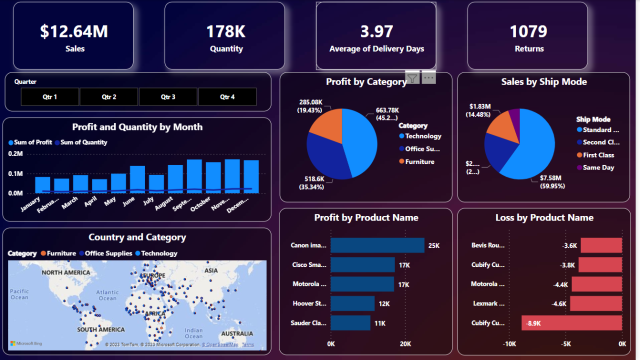
Description
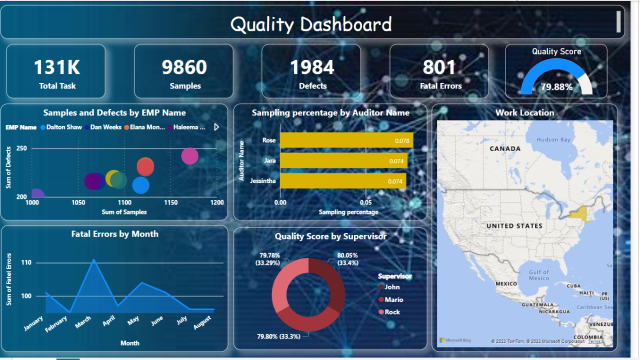
I have created new Quality dashboard and gathered the insights for business for future operations to work upon.
Steps:
1.Imported the datasets from excel to power BI
2.Transformed and cleaned data in Power Query Editor
3.Data modelling of data sets
4.Used some Dax measures for calculation
5.Used visual charts for visualization
(Charts like KPI’s ,Area chart ,bar chart, donut chart, scattered plot chart and field Map
