Description
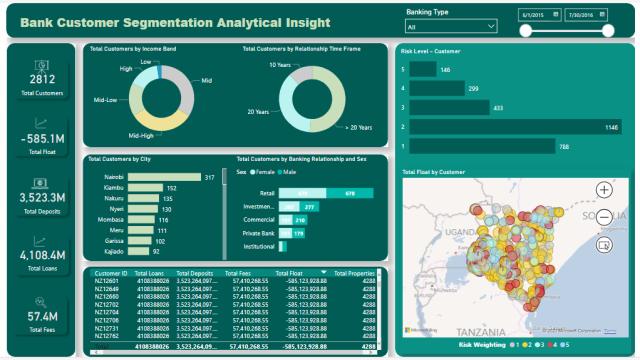
The Bank Customer Segmentation Analytical Dashboard provides a comprehensive analysis of customer data to facilitate effective customer segmentation strategies. With a focus on key metrics and customer characteristics, this dashboard enables banks to understand and target their customer base more effectively. The dashboard’s key features include customer segmentation by income band, relationship time frame, city, banking relationship, sex, and risk level. Additionally, it provides a map visualization of total float by customer and a table displaying customer IDs along with their total loans, total deposits, total fees, total float, and total properties.
Total Customers by Income Band:
This section of the dashboard displays the distribution of customers across different income bands. It enables banks to identify the segments that contribute most to their customer base. By understanding the income distribution, banks can develop targeted products and services, adjust marketing strategies, and personalize offerings to meet the specific needs of each income segment.
Total Customers by Relationship Time Frame:
The Total Customers by Relationship Time Frame feature provides insights into customer loyalty and engagement by analyzing the duration of the customer-bank relationship. It helps banks identify long-term loyal customers and understand the churn rate among different customer cohorts. By segmenting customers based on their relationship time frame, banks can tailor retention strategies and design customer loyalty programs to enhance engagement and satisfaction.
Total Customers by City:
This section presents a breakdown of customers by city, providing valuable information about the geographical distribution of the customer base. It enables banks to identify regions where they have a strong presence and areas that offer growth opportunities. By analyzing customer distribution by city, banks can localize their marketing efforts, optimize branch locations, and customize their product offerings to cater to the needs of specific regions.
Total Customers by Banking Relationship and Sex:
This feature analyzes customer demographics by banking relationship type and sex. It allows banks to understand the composition of their customer base in terms of different banking relationship types (e.g., Retail, Investment, Commercial, Private Bank, Institutional) and gender. This information can assist in tailoring marketing strategies, developing personalized products, and providing targeted financial solutions that align with the needs and preferences of different customer segments.
Risk Level Customer:
The Risk Level Customer section evaluates the risk profile of customers, helping banks assess the creditworthiness and potential default risk associated with each customer. It enables the identification of high-risk customers who may require additional monitoring and risk mitigation strategies. By segmenting customers based on their risk level, banks can implement appropriate risk management practices, such as setting credit limits, offering tailored loan terms, and assigning risk ratings to customers.
Map of Total Float by Customer:
This feature provides a visual representation of the total float amount held by each customer on a geographical map. It helps banks identify customers with significant float amounts and understand their spatial distribution. By visualizing the total float by customer, banks can analyze float concentration in specific regions, identify potential liquidity issues, and optimize cash management strategies.
Table Showing Customer ID and Total Loans, Total Deposits, Total Fees, Total Float, Total Properties:
This table presents customer-specific details, including customer IDs, total loans, total deposits, total fees, total float, and total properties. It offers a comprehensive overview of each customer’s financial relationship with the bank. By examining these details, banks can evaluate customer profitability, identify cross-selling opportunities, and personalize their offerings based on individual customer needs and preferences.
Key Performance Indicators (KPIs):
The dashboard prominently displays essential KPIs, including total customers, total float, total deposits, total loans, and total fees. These metrics provide an overview of the bank’s customer base, the amount of funds held in customer accounts, the extent of lending activities, and the revenue generated from fees. By monitoring these KPIs, banks can assess their overall performance and make informed decisions to improve profitability and customer satisfaction.
Filtering Options:
The dashboard offers filtering options to analyze data based on bank type and date. Users can filter the data to focus on specific bank types: Retail, Investment, Commercial, Private Bank, and Institutional. This allows for a deeper analysis of customer segmentation within each banking relationship category. Additionally, users can filter the data by date to analyze trends and changes over time, enabling banks to identify seasonal patterns or track the effectiveness of marketing campaigns and strategies.
