Description
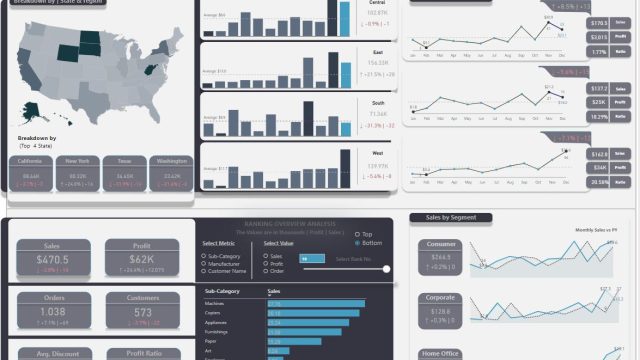
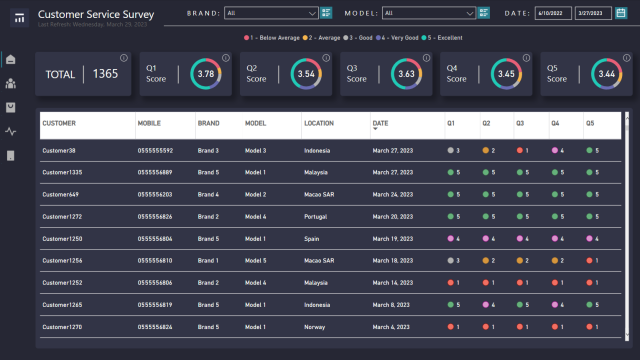
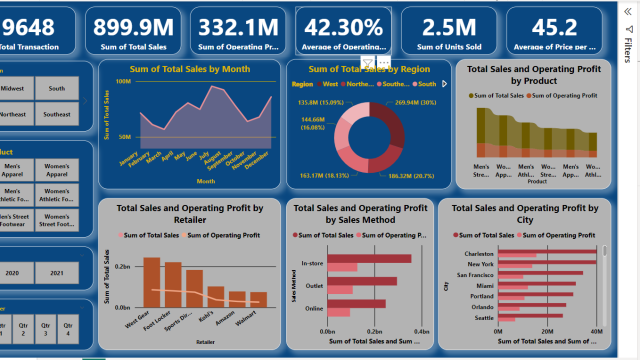
The Superstore Dashboard provides a comprehensive overview of the latest orders and their key metrics. This dynamic dashboard focuses on comparing the current year’s data with the previous year, shedding light on significant analyses such as top and bottom scenarios. Each element of the dashboard is meticulously explained, ensuring a step-by-step understanding of its features. I have taken great care to simplify the complex DAX expressions, making them accessible to all users. Moreover, I have optimized the DAX code, ensuring its conciseness without compromising clarity. The dashboard also offers alternative scenarios, including the ability to switch between line and bar charts, as well as the highlighting of data points and bars with different colors. Furthermore, the variance scenario is meticulously organized, with each metric neatly categorized in separate folders. By following the structured presentation and user-friendly DAX code, users can easily comprehend the analysis, even with minimal prior experience. If you have any further questions, please feel free to reach out, and I will respond as promptly as possible.
