Description
Report Pages:
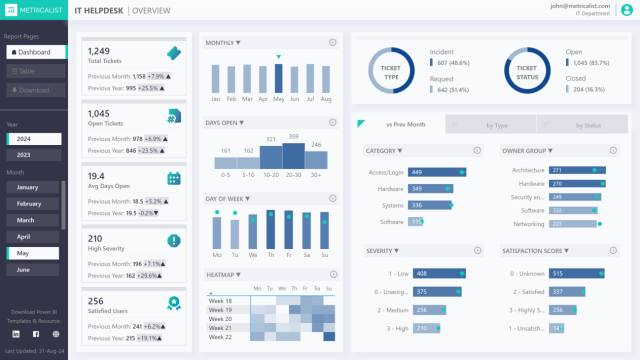
- Overview: The interactive report offers a high-level overview of key metrics, including ticket volume, average resolution time, and customer satisfaction scores. Easily identify trends and make data-driven decisions to enhance your help desk efficiency.
- Total Tickets: Track the total number of tickets received each month, with comparisons to previous months and years to identify trends.
- Open Tickets: Monitor the number of open tickets and their progression over time to ensure timely resolution.
- Average Days Open: Analyze the average time tickets remain open to gauge efficiency and identify areas for process improvement.
- High Severity Tickets: Keep an eye on high-severity tickets to ensure critical issues are addressed promptly.
- Satisfied Users: Measure customer satisfaction based on ticket feedback to maintain high service quality.
- Table: For a more granular look at your help desk operations, the Table Page provides detailed information on individual tickets. The ability to filter data by year and month ensures you can focus on specific periods. The table can be exported in CSV format for additional analysis and sharing with stakeholders.
- Ticket Details: Comprehensive information on each ticket, including creation date, type, category, severity, requestor, satisfaction rating, status, and days open.
Features:
- Utilized the latest features and best practices in Power BI in report design.
- Lightweight UI
- Responsive Design with Mobile View
- Modern page navigation design
- New filter visual
- KPI Cards
- Dynamic Highlighting
- Field Parameters
- Modern Theme + embedded icons
Includes:
- Power BI Help Desk report file (.pbix)
- Modern Business Theme (.json)
- Icons
- Sample dataset
Changelog:
1.2.0 – 2024.09.04
* Parameterized the data source
1.1.0 – 2024.07.11
* Fixed Layout
* Revised Theme
1.0.0 – 2024.07.08
* Initial Release
Is really good, but what about the agents? I would like to see agents efficiency, for example.
Power BI Kit’s Help Desk Report Template is a game-changer for tracking and analyzing support performance. It offers clear visuals, real-time insights, and customizable dashboards, making it easy to monitor response times, ticket status, and agent efficiency. The intuitive layout ensures quick access to key metrics, helping businesses improve customer service. With automated updates and seamless integration, it streamlines help desk management effortlessly. This template is ideal for organizations looking to enhance productivity and decision-making. Highly recommended for those seeking an efficient, user-friendly, and data-driven approach to help desk reporting! ????