Description
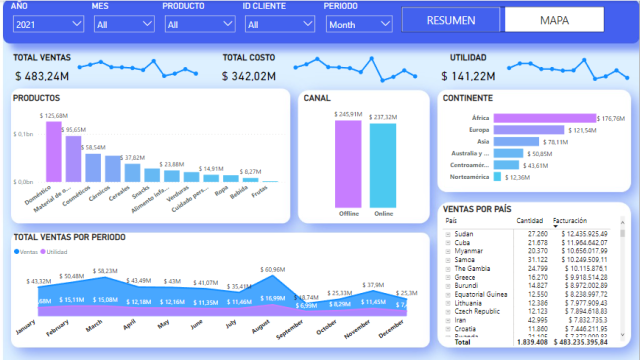
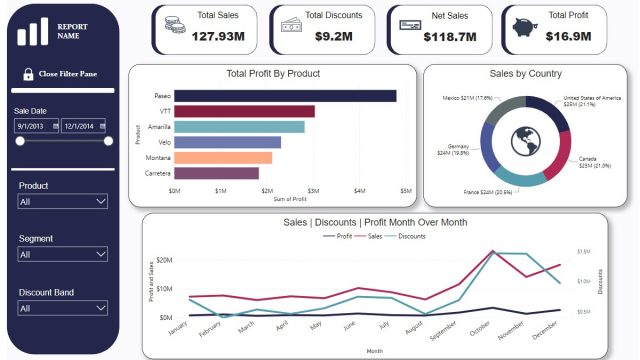
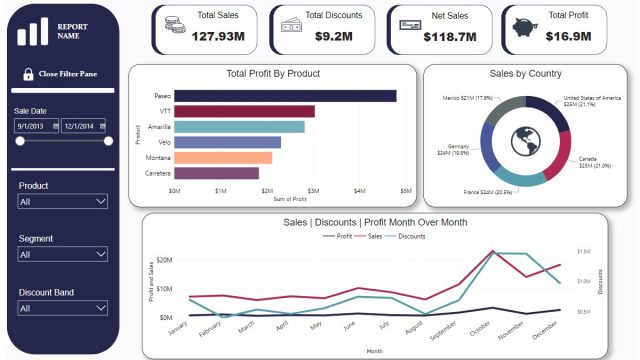
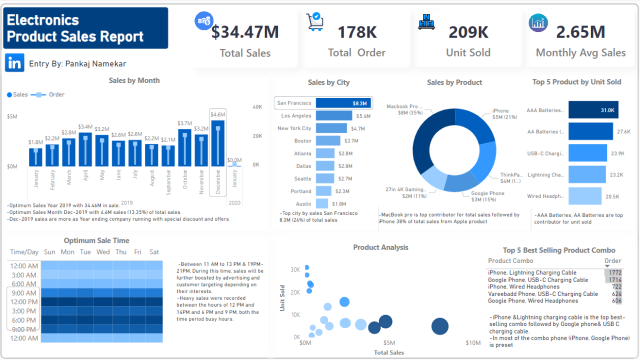
The Sales, Cost and Revenue Dashboard is a powerful tool that enables users to monitor and analyze key performance indicators (KPIs) related to their business’s financial performance. This Power BI dashboard provides a comprehensive view of sales, and revenue metrics, allowing stakeholders to quickly identify trends, patterns, and opportunities for improvement. The dashboard features several interactive visualizations that enable users to drill down into the data and explore it in detail. The main components of the dashboard include: Summary of the sales per country, product, channel and an overview of the sales and revenue over the months. Map of the location of the country for the sales.
