Power BI Templates
-
$59.00
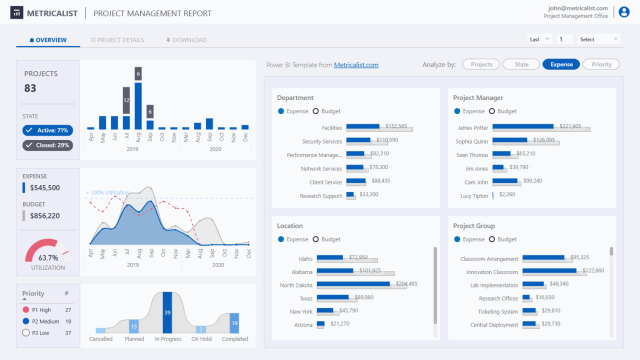
Our latest Project Management Report Template was designed to provide comprehensive insights into your project’s performance, progress and budget allocation. This template is perfect for project managers looking to optimize their project tracking and reporting with Power BI.
-
$49.00
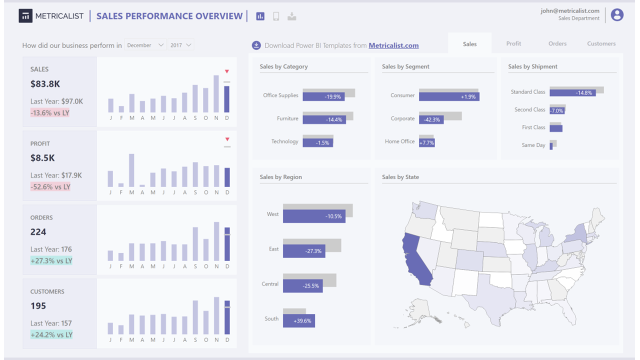
Our Sales Performance Report template provides an in-depth analysis of sales data, helping you identify trends, monitor performance, and make data-driven decisions. This report is designed to be both comprehensive and user-friendly, ensuring that you can get the insights you need with ease.
-
$59.00
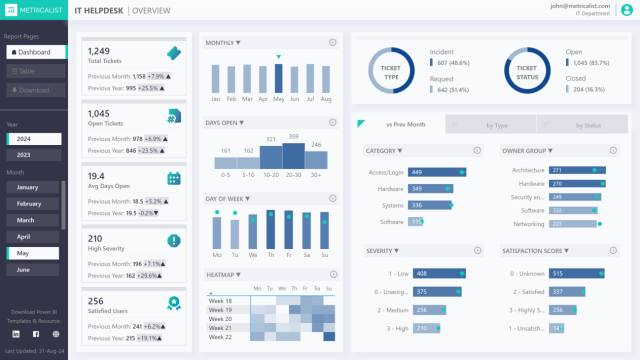
Our IT Help Desk Report provides comprehensive insights into your help desk operations, allowing you to monitor performance and identify areas for improvement. The modern and clean layout is both easy on the eyes and easy to revise and maintain; no unnecessary visual elements and complex design/bookmarks that add additional overhead when loading the report.
-
$19.99
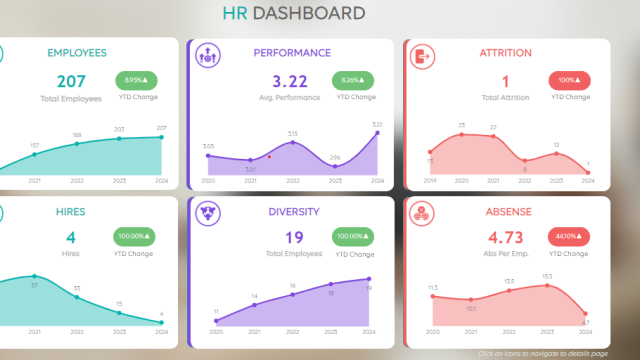
HR dashboard is a powerful tool used by Human Resources departments to visually track, analyze, and display key performance indicators (KPIs), HR metrics, and key data points related to employee performance, recruitment, retention, and overall workplace management.
It is divided into mainly 6 sections: Employees Hires Diversity Performance Absence Attrition -
$16.00
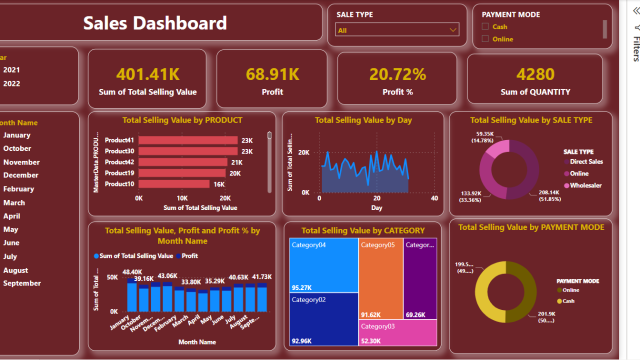
I am excited to share sales dashboard with the help of power bi desktop.
The whole process involved the following
1.Fetch the data
2.Cleaning the data
3.Use functions
4.Use KPIs ,Donut chart ,Bar chart ,Slicers
Feedbacks and suggestions are welcomed.
-
$20.00
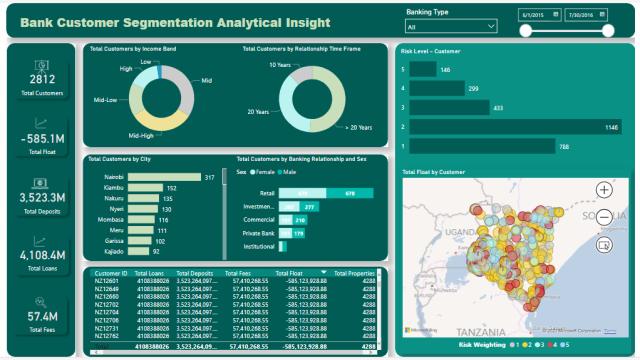
The Bank Customer Segmentation Analytical Dashboard empowers banks to gain valuable insights into their customer base and optimize their strategies accordingly. By analyzing customer data based on income band, relationship time frame, city, banking relationship, sex, and risk level, banks can develop personalized offerings, target specific customer segments, and enhance customer satisfaction. The dashboard’s visualizations, tables, and KPIs provide a comprehensive view of customer characteristics and financial relationships, enabling banks to make data-driven decisions to improve profitability, mitigate risks, and drive customer loyalty
-
$20.00
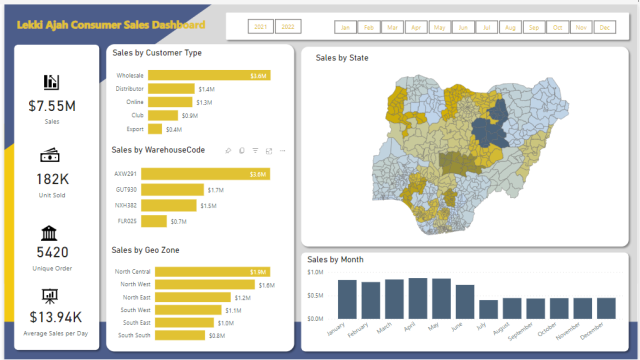
The Consumer Sales Goods Dashboard offers a comprehensive and interactive overview of sales performance in the consumer goods sector. By analyzing sales by customer type, state, geographical location, warehouse, and date, businesses can gain valuable insights into their sales trends and make informed decisions to optimize their operations and maximize revenue.
-
-
$17.00
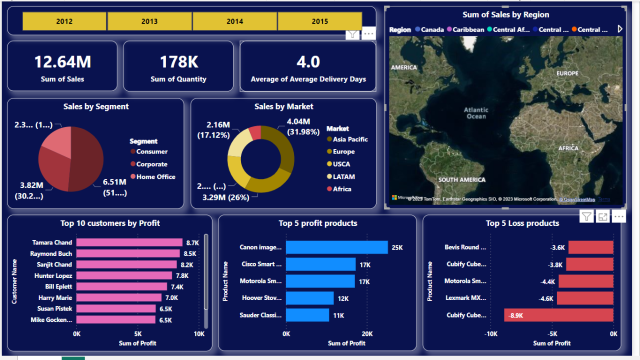
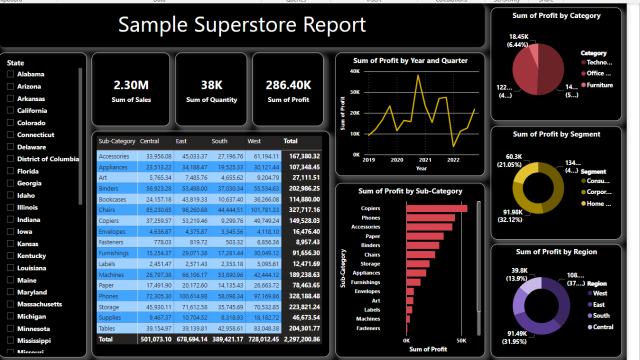
I have created an interactive dashboard on sample superstore from Microsoft Power BI desktop for business intelligence learning .It gives an overview of Sample superstore data.
-
$11.00
This Sales dashboards present relevant and actionable sales data, allows you to make data-driven decisions quickly. Having the right sales dashboards based on current data leads to time savings.
