Power BI Templates
-
$14.00
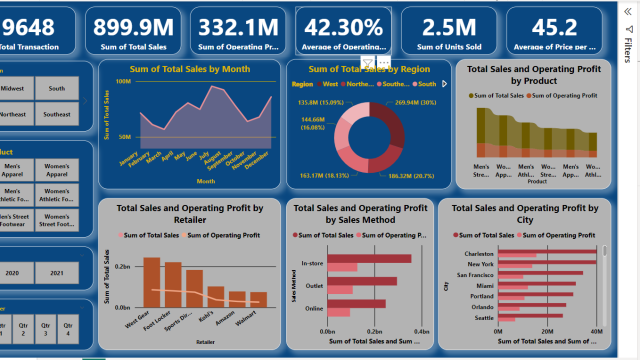
Below is the dashboard that I created .It depicts total sales ,profit made by a store .Using the slicers provided we can see how various parameters affect the sales of a store.
-
$14.00
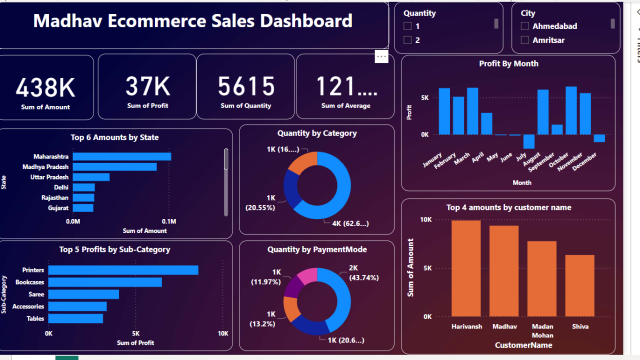
The owner of the Madhav Store wants us to help them create a dashboard to track and analyze online sales across India . Created an interactive dashboard to track and analyze online sales data.
-
$14.00
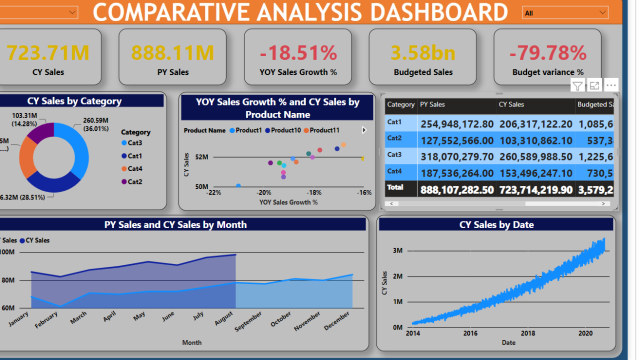
I have finished the project on Comparative Analysis dashboard by creating a dashboard in power BI that displays all of the key performance indicators and metrices that are relevant to the dataset.
-
$14.00
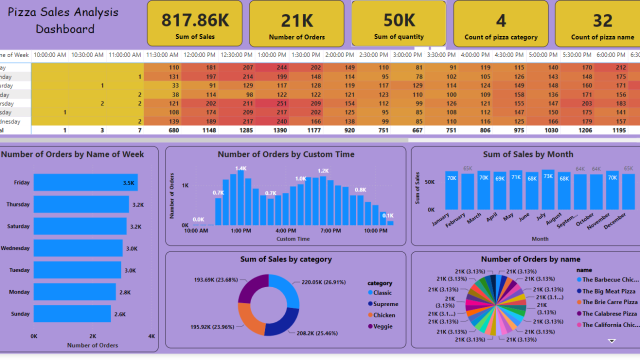
Overall ,the pizza sales power bi dashboard provides valuable insights into the pizza industry and can help businesses make informed decisions regarding sales and marketing strategies.
-
$14.95
I have created an interactive dashboard on HR analysis using power BI desktop.
It gives an overview of HR analysis data.
-
$14.00
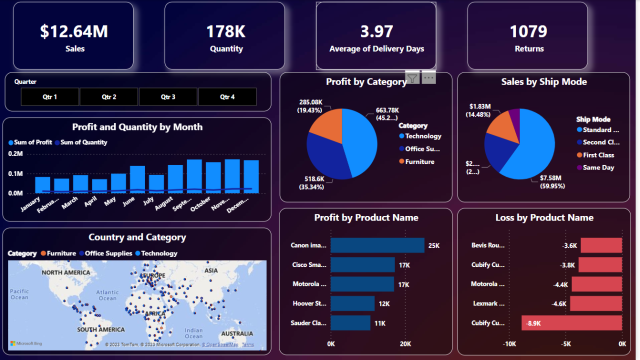
Created a user interactive \”Global market Sales\” interactive dashboard report .This dashboard is an interactive dashboard that shows sales, quantity, average delivery days and return order.
-
$14.00
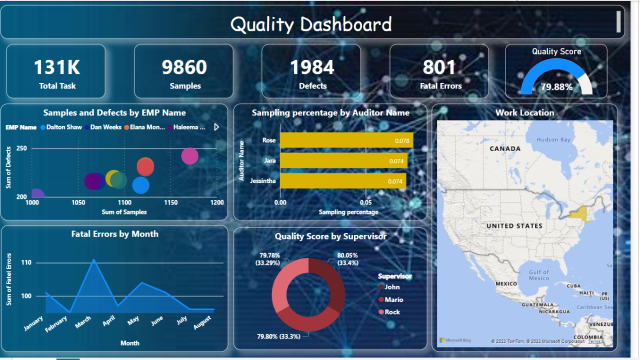
I have created new Quality dashboard and gathered the insights for business for future operations to work upon.
Steps:
1.Imported the datasets from excel to power BI
2.Transformed and cleaned data in Power Query Editor
3.Data modelling of data sets
4.Used some Dax measures for calculation
5.Used visual charts for visualization
(Charts like KPI’s ,Area chart ,bar chart, donut chart, scattered plot chart and field Map )
-
$9.99
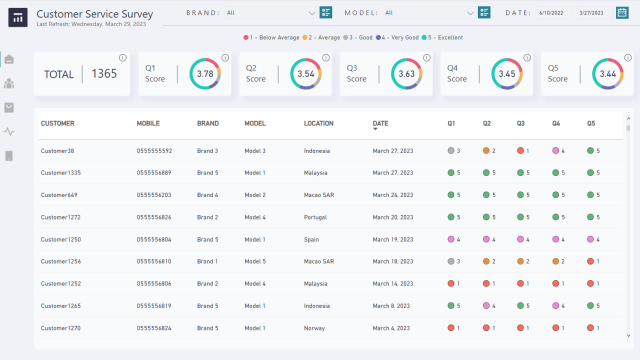
Simple Power BI starter template for Customer Service Survey
- Track respondents count
- Questionnaire/category scores
- Answers log
Contains landing report page + placeholders pages. The layout was designed using Power BI Wireframe Template and will be compatible to all Metricalist Power BI themes and layout.
-
$29.00
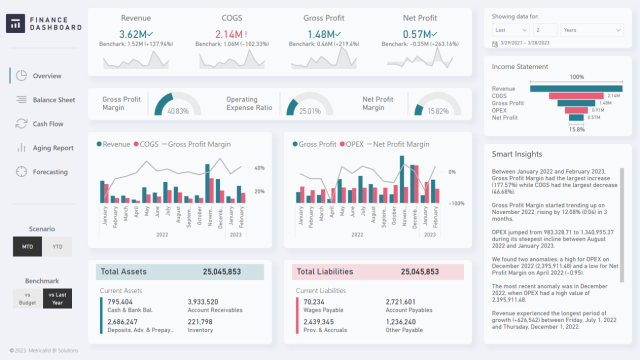
Power BI starter template for Finance Dashboard
- Track Finance KPI
- Revenue
- Cost of goods
- Expense
- Profit
- Margin
- Analyze MTD/YTD
- Benchmark vs LY or Budget
Contains landing report page + placeholders pages. The layout was designed using Power BI Wireframe Template and will be compatible to all Metricalist Power BI themes and layout.
- Track Finance KPI
-
$20.00
Contains.
- PBIX file
- Data set
- Power Point template for customization
