Description
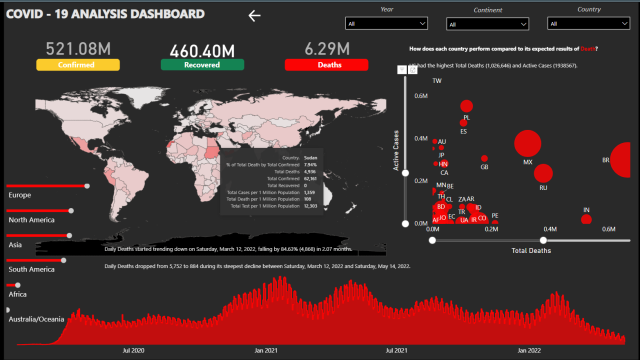
The COVID-19 Analysis Dashboard provides comprehensive insights into the global impact of the COVID-19 pandemic. It consists of three main pages: Confirmed Cases, Recovered Cases, and Death Cases. Each page offers a detailed analysis of the respective cases, including distribution by continent, a map showcasing all countries, active cases, and date. The dashboard also provides filtering options to analyze data based on the year, continent, and country.
Page 1: Confirmed Cases
The Confirmed Cases page presents an analysis of the total number of confirmed COVID-19 cases worldwide. It includes a visual representation of the distribution of cases by continent, enabling users to identify regions that have been significantly affected by the virus. Additionally, a map is provided, highlighting all countries and their respective number of confirmed cases. Users can also analyze the number of active cases and track the progression of confirmed cases over time by selecting the desired date. The filtering options allow users to focus on specific years, continents, and countries for a more targeted analysis.
Page 2: Recovered Cases
The Recovered Cases page provides insights into the number of COVID-19 cases that have resulted in recovery. It offers a distribution analysis by continent, allowing users to understand the regions with higher recovery rates. The accompanying map displays all countries, with a color-coded representation of the number of recovered cases. Users can also analyze the number of active cases and track the recovery progress over time by selecting the desired date. The filtering options enable users to examine specific years, continents, and countries to gain a deeper understanding of recovery trends.
Page 3: Death Cases
The Death Cases page focuses on the analysis of COVID-19-related fatalities. It provides a breakdown of deaths by continent, enabling users to identify regions with higher mortality rates. The map visualization displays all countries, color-coded based on the number of deaths. Users can track the number of active cases and analyze the progression of deaths over time by selecting the desired date. The filtering options allow users to drill down into specific years, continents, and countries to gain more granular insights into the impact of COVID-19.
Filtering Options: The dashboard offers filtering options to customize the analysis based on the desired parameters. Users can filter the data by year, allowing for a comparison of COVID-19 trends over different time periods. The continent filter enables users to focus on specific regions of interest, gaining insights into the impact of the virus on a continental scale. Furthermore, users can filter the data by country to analyze the COVID-19 situation in individual countries, providing a localized perspective of the pandemic’s effects.


