Description
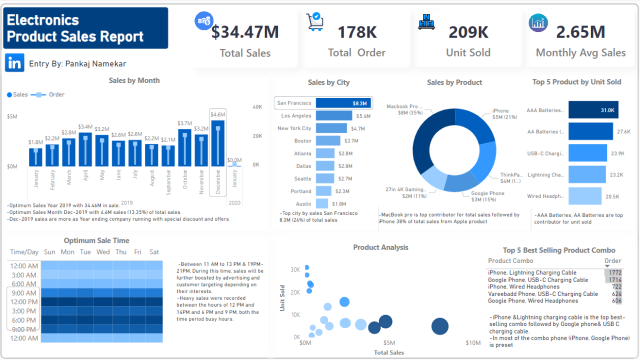
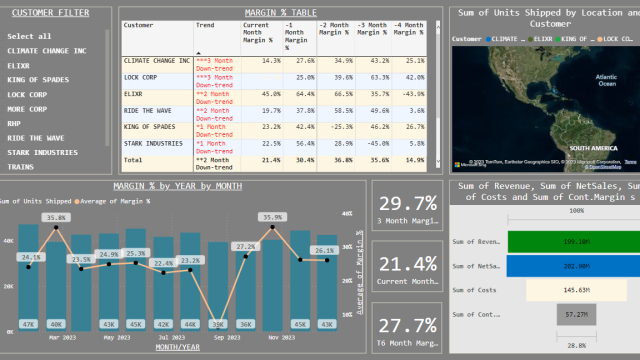
Here is the Sample one-page report I developed to analyze the electronic product sales analysis. Below are key steps i have followed during building the report. 1. Data Source and Query: Connect to your data source(s) in Power BI and import the required data. You can use the Power Query Editor to shape and transform the data, ensuring it is in a suitable format for analysis. 2. Data Modeling: Create a data model by defining relationships between tables and creating calculated columns or measures using DAX (Data Analysis Expressions). This step is crucial for organizing and preparing your data for visualization. 3. Report Layout: Design the visual layout of your report by selecting the appropriate visualizations from Power BI’s vast library. Drag and drop visual elements onto the canvas and customize their properties, such as data fields, colors, and formatting. 4. Visual Interactions: Configure interactions between visuals to allow users to filter or highlight data dynamically. Utilize Power BI’s interactive features, such as cross-filtering and drill-through, to enable users to explore data at different levels of detail. 5. Report Formatting: Enhance the aesthetics and usability of your report by formatting elements like titles, fonts, backgrounds, and gridlines. Ensure consistency and readability throughout the report. 6. Report Navigation: Create navigation elements, such as buttons or tabs, to enable users to navigate between different pages or sections of your report. This helps organize and present information in a user-friendly manner. 7. Report Publishing and Sharing: Once your report is complete, publish it to the Power BI service or save it as a file to share with others. You can set up scheduled data refreshes and define access permissions to control who can view or edit the report. 8. Report Maintenance and Updates: Regularly review and update your report to reflect any changes in data or business requirements. Consider incorporating user feedback and iteratively improve the report’s functionality and design.
