Sales
-
$15.00
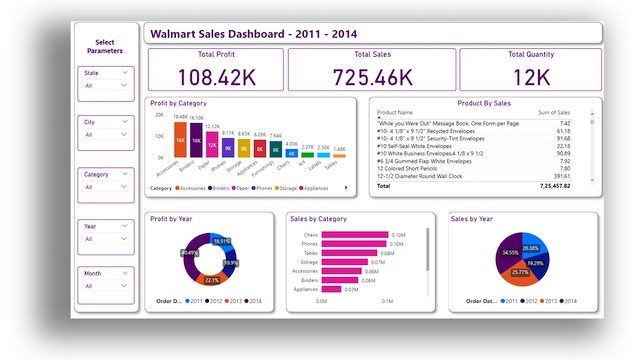
Our Walmart Sales Dashboard Template is designed to provide detailed insights into your sales performance, profitability, and trends. This template is ideal for retail managers and analysts looking to track key performance indicators (KPIs) and analyze sales data across multiple categories and locations.
-
$14.00
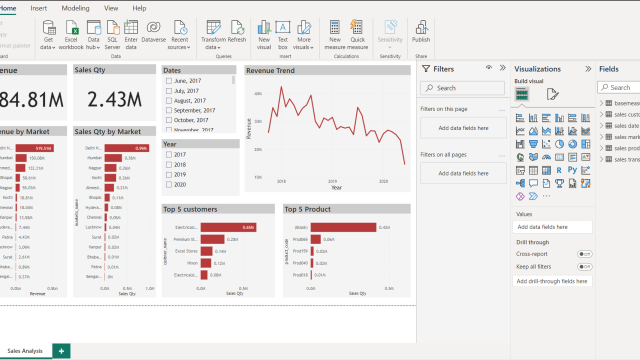
I have prepared dashboard on Sales Analysis Dashboard. While preparing this I followed the following steps .
Steps:
1.Gathered dataset from Kaggle.
2.Used import query mode
3.Performed ETL process in query
4.Created Visualization
Tools:
MS Excel ,Power BI ,Power Query
-
$39.00
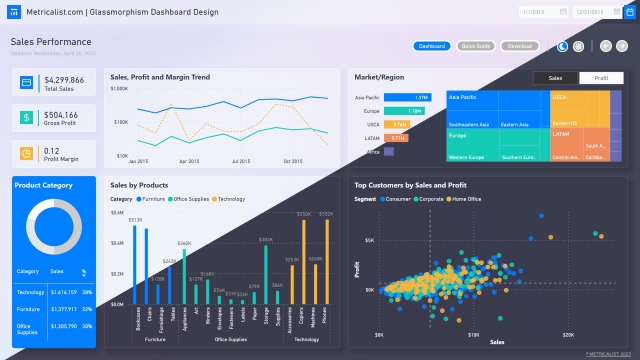
The glassmorphism UI design can elevate the visual appeal and functionality of Power BI reports. This design style, characterized by translucent and blurred elements, creates a sleek and modern aesthetic that enhances the report’s impact.
The use of layers, gradients, and vivid colors provide a sense of depth and dimension, making the data more engaging and easier to understand. By incorporating glassmorphism into Power BI reports and templates, users can deliver a highly professional and polished product that is sure to impress stakeholders, team members, and customers.
-
-
-
$14.00
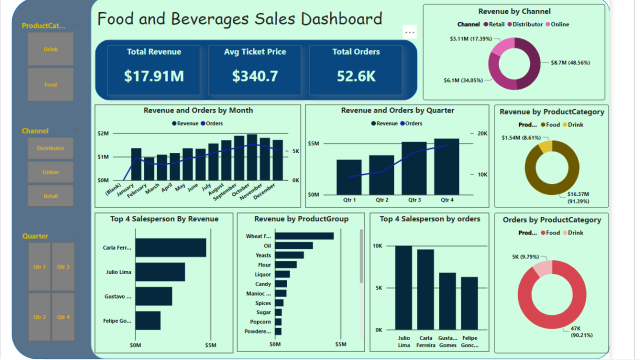
I have created this dashboard to analyze Food and beverage sales and order data by different views which can give insights in one look.
-
$14.00
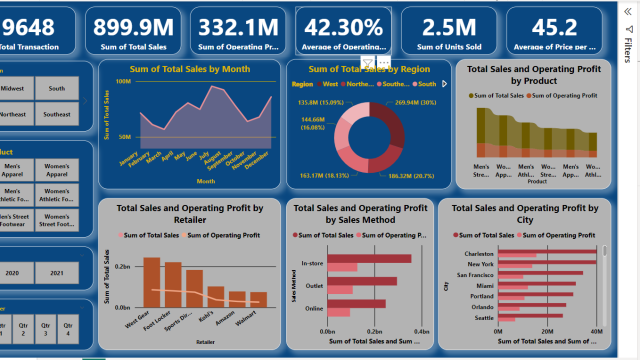
Below is the dashboard that I created .It depicts total sales ,profit made by a store .Using the slicers provided we can see how various parameters affect the sales of a store.
-
$14.00
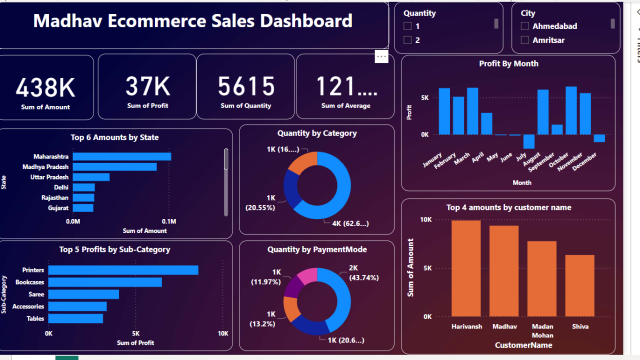
The owner of the Madhav Store wants us to help them create a dashboard to track and analyze online sales across India . Created an interactive dashboard to track and analyze online sales data.
-
$14.00
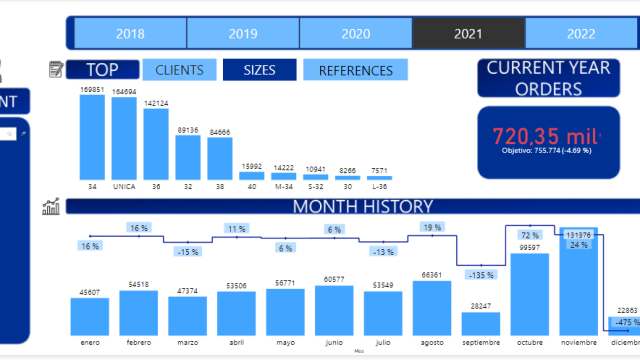
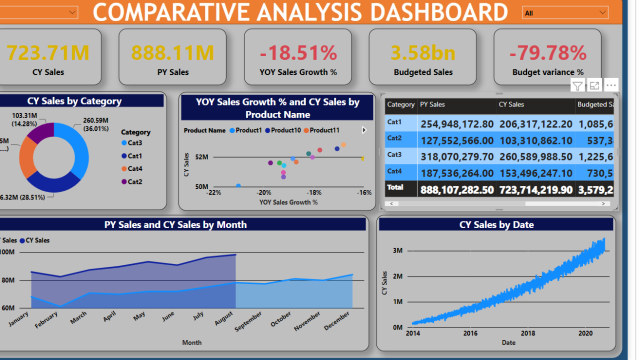
I have finished the project on Comparative Analysis dashboard by creating a dashboard in power BI that displays all of the key performance indicators and metrices that are relevant to the dataset.
-
$14.00
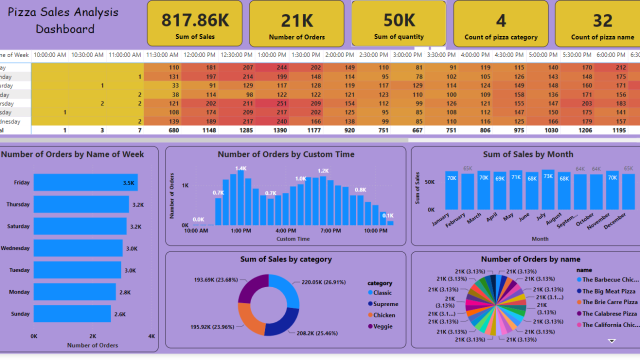
Overall ,the pizza sales power bi dashboard provides valuable insights into the pizza industry and can help businesses make informed decisions regarding sales and marketing strategies.
