Power BI Solutions
-
$10.00
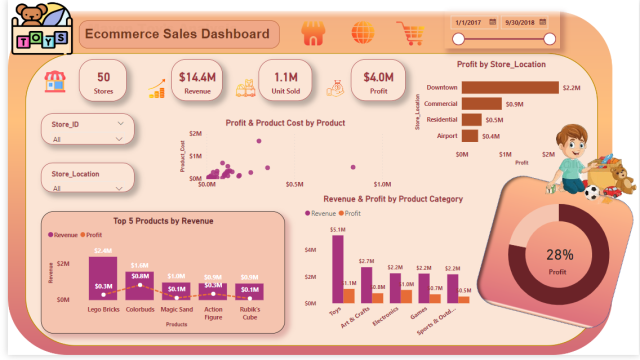
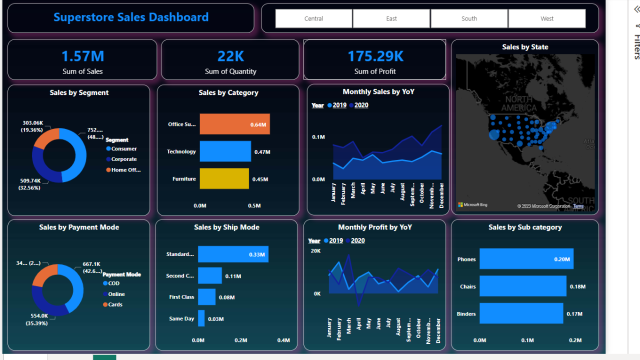
This dashboard will provide you the insights about your business requirements, will provide you the accurate performance indicator
-
$11.00
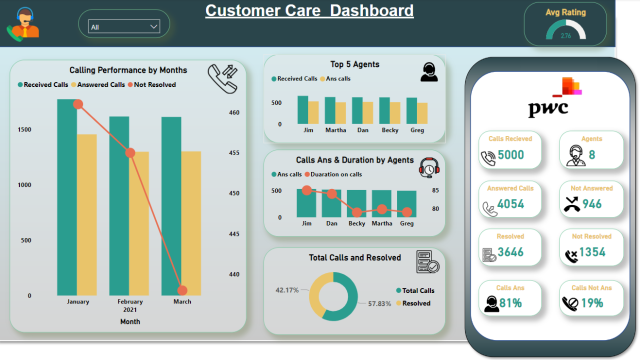
With this dashboard you can find the insights about the customer care department and will help you to analyze about the performance of your staff.
-
$10.00
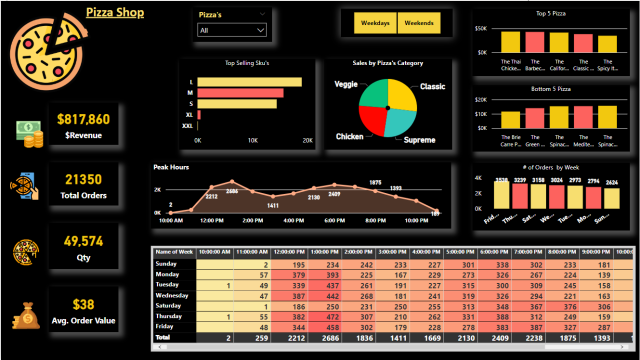
This Dashboard is specially for F&B Outlets this dashboard will help you to identify your Peak hours and Low hours in terms of Orders and will help to you understand which Dish or Drink working great or not good
-
$20.00
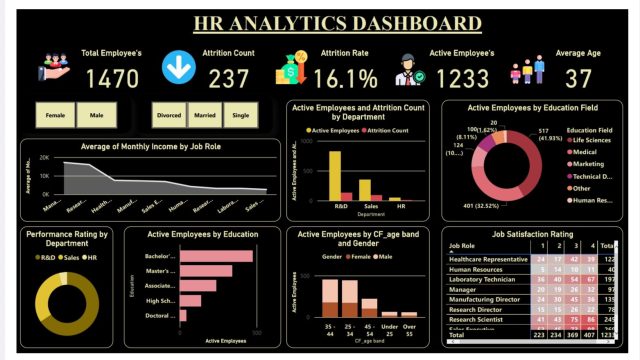
This dashboard will definitely help you to understand what’s going in your Human Resource Department and will give a proper suggestion about the employees Attrition
-
$10.00
This dashboard is specially for healthcare department & students how pursue his/her career in healthcare sector.
-
$19.00
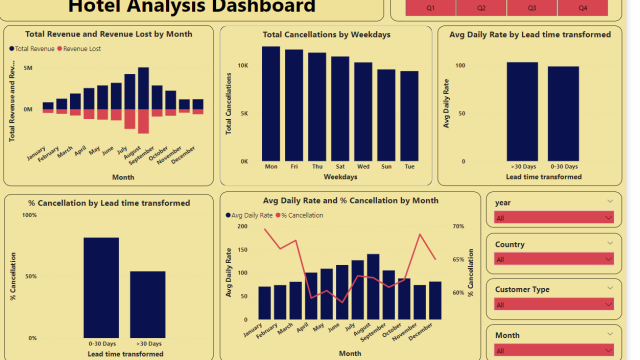
I prepared a Dashboard on the hotel dataset.
Findings:
Total Revenue and Total Revenue loss by month.
Average daily rate and %cancellation by month
Cancellation by weekdays
Average daily rate
Cancellation Rate
-
$30.00
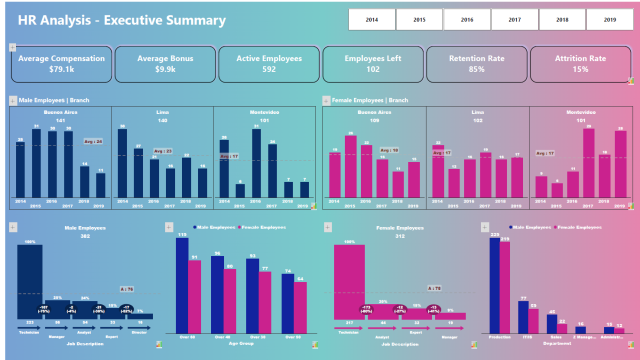
I am an HR data analyst and my role is to develop an HR dashboard using Inforiver custom visuals for the organization.
-
-
$14.00
The goal is to share valuable insights and actionable information that can drive strategic decision making and support the supermarket goals for growth ,efficiency and customer satisfaction.
-
$18.00
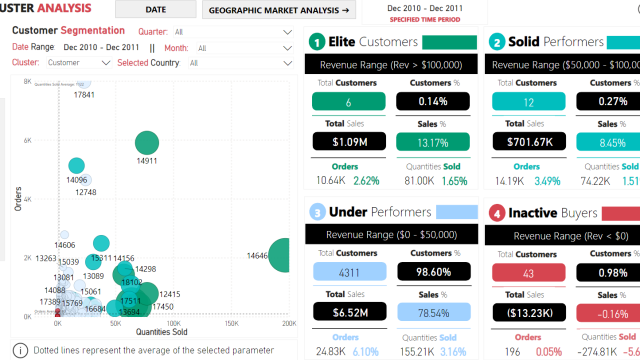
The Power BI Dashboard template for Customer Segmentation includes:
- Overview Page
- Ranking Analysis Page
- Customer Analysis Page
- Predictive Analysis Page
- Cluster Analysis Page
- Geographic Market Analysis Page
- Country-Wise Sales Analysis Page (Drill-Down Page)
This dashboard template has been created using Microsoft Power BI. Moreover, it contains seven main dashboard pages and six drill-down dashboard pages, along with a cool tooltip feature when hovering over certain key performance indicators (KPIs).
