Power BI Designs
-
$100.00
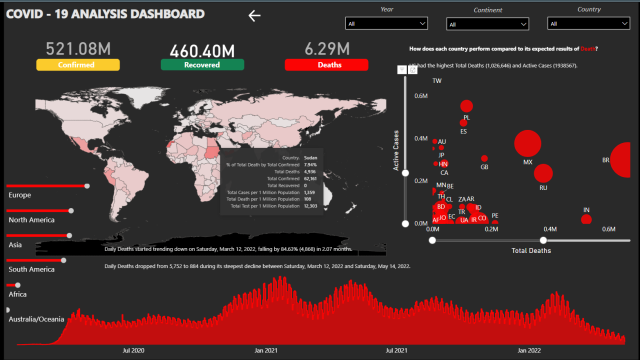
The COVID-19 Analysis Dashboard provides a comprehensive overview of the global COVID-19 situation. Through detailed analysis of confirmed, recovered, and death cases, users can track the spread and impact of the virus across continents and countries. The filtering options for year, continent, and country allow for a more targeted analysis, providing valuable insights for policymakers, researchers, and the general public to understand and respond to the ongoing pandemic.
-
-
$39.00
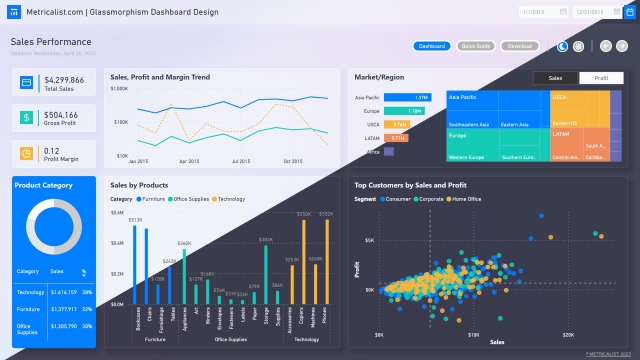
The glassmorphism UI design can elevate the visual appeal and functionality of Power BI reports. This design style, characterized by translucent and blurred elements, creates a sleek and modern aesthetic that enhances the report’s impact.
The use of layers, gradients, and vivid colors provide a sense of depth and dimension, making the data more engaging and easier to understand. By incorporating glassmorphism into Power BI reports and templates, users can deliver a highly professional and polished product that is sure to impress stakeholders, team members, and customers.


