Power BI Templates
-
$14.00
The goal is to share valuable insights and actionable information that can drive strategic decision making and support the supermarket goals for growth ,efficiency and customer satisfaction.
-
$18.00
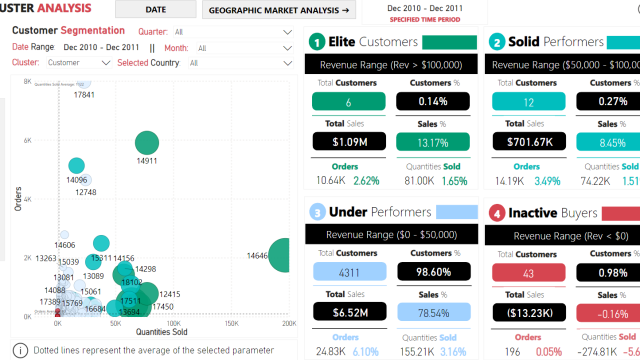
The Power BI Dashboard template for Customer Segmentation includes:
- Overview Page
- Ranking Analysis Page
- Customer Analysis Page
- Predictive Analysis Page
- Cluster Analysis Page
- Geographic Market Analysis Page
- Country-Wise Sales Analysis Page (Drill-Down Page)
This dashboard template has been created using Microsoft Power BI. Moreover, it contains seven main dashboard pages and six drill-down dashboard pages, along with a cool tooltip feature when hovering over certain key performance indicators (KPIs).
-
$29.00
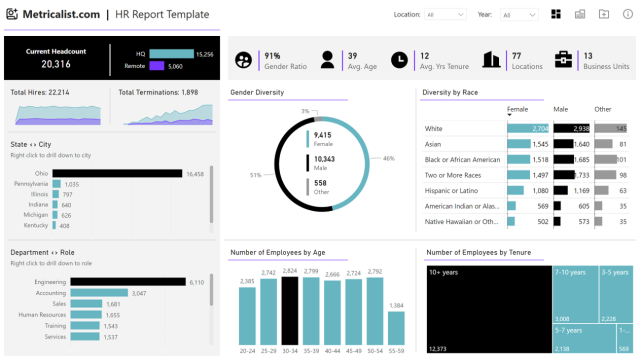
Gain valuable insights and a comprehensive analysis of your workforce through a sleek and modern Power BI report template for Human Resources
- This plug and play template allow you to input your employee data into a simple excel file and load it to the HR Dashboard.
- Analyze key HR employee metrics, providing a deeper understanding of workforce composition and demographics.
- Includes an employee directory page which can be filtered and allows for exporting the data.
-
$15.00
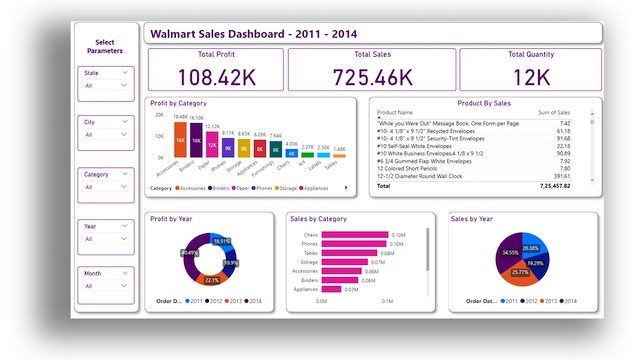
Our Walmart Sales Dashboard Template is designed to provide detailed insights into your sales performance, profitability, and trends. This template is ideal for retail managers and analysts looking to track key performance indicators (KPIs) and analyze sales data across multiple categories and locations.
-
$14.00
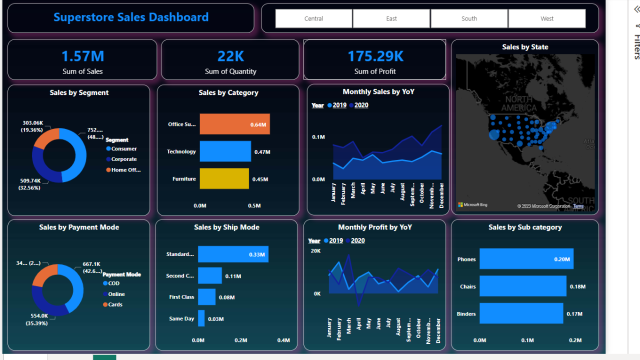
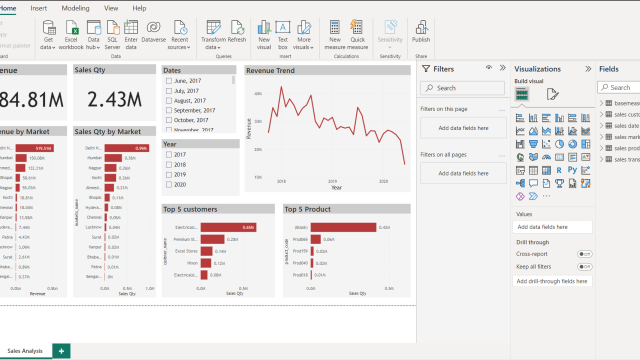
I have prepared dashboard on Sales Analysis Dashboard. While preparing this I followed the following steps .
Steps:
1.Gathered dataset from Kaggle.
2.Used import query mode
3.Performed ETL process in query
4.Created Visualization
Tools:
MS Excel ,Power BI ,Power Query
-
$39.00
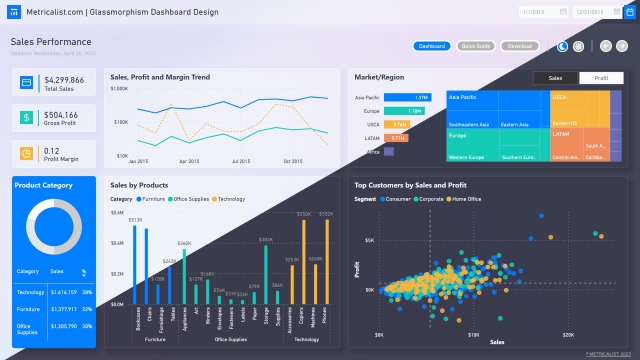
The glassmorphism UI design can elevate the visual appeal and functionality of Power BI reports. This design style, characterized by translucent and blurred elements, creates a sleek and modern aesthetic that enhances the report’s impact.
The use of layers, gradients, and vivid colors provide a sense of depth and dimension, making the data more engaging and easier to understand. By incorporating glassmorphism into Power BI reports and templates, users can deliver a highly professional and polished product that is sure to impress stakeholders, team members, and customers.
-
-
-
$56.00
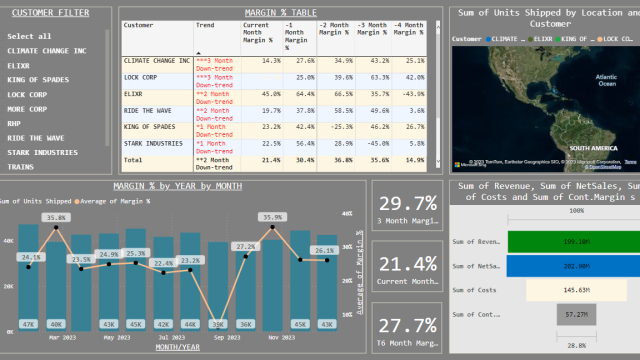
Margin Down-Trend Analysis report provides one with the first initial steps in determining where the problem areas are held. It is simple, to the point, and a solid base for one to build upon.
-
$14.00
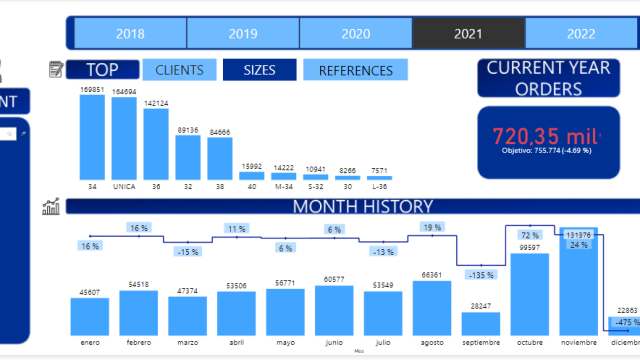
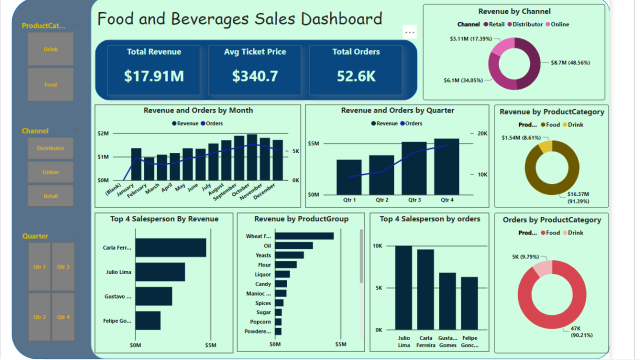
I have created this dashboard to analyze Food and beverage sales and order data by different views which can give insights in one look.
